Posts

How to approximate the Flood polygon created in InfoSWMM RAM by using Arc Toolbox

Image
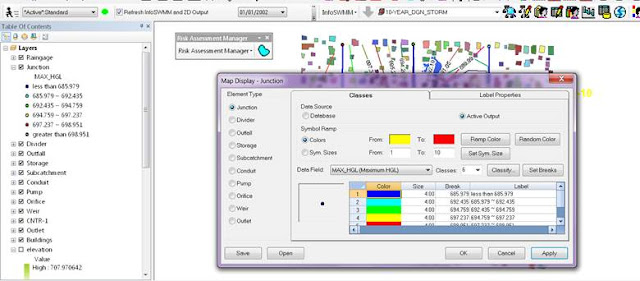
How to approximate the Flood polygon created in InfoSWMM RAM by using Arc Toolbox and Subcatchment Manager Tools Step 1 – Run InfoSWMM and use Map Display to show the Maximum HGL. This is just for reference to the later created polygons. Step 2 – not needed but as a check to Steps 3 to 5.  Use InfoSWMM RAM to show the area flooding based on the Maximum head or HGL.  This is an approximation of the flooding you would show with have with InfoSWMM 2D.  The maximum HGL is intersected with the DEM or TIN and the DEM elevations below the Maximum HGL are shown in Blue. Step 3 – Create a contour based on the Maximum HGL in the InfoSWMM run.  Use Contour in the InfoSWMM Browser to create the contour. Step 4 – The created Contour from the Maximum HGL Step 5 – Use the Polyline to Raster Arc Toolbox command to make a Raster from the Contour Step 6 – Optionally you an create a Raster using Convert in the InfoSWMM Subcatchment Manger. The tool creates a DEM from a Contour Step 7 – Use th

A new API way of looking at this Blog

Image
A new API way of looking at this Blog You can click on Get Posts to see the post, Clicking on a label will make a Pop Up Window http://s3.amazonaws.com/bloggerapi/index.html Pop Up Window

Innovyze and XP Solutions Merge

Image
Innovyze and XP Solutions Merge The New Innovyze Combines Two of the Most Powerful and Recognizable Names in the Marketplace; A Winning Combination for the Critical Water and Wastewater Industry Broomfield, Colorado, USA, May 16, 2017 – Innovyze, a leading global innovator of business analytics software and technologies for smart wet infrastructure, and XP Solutions, a leading provider of software solutions for stormwater/floodwater modeling and drainage design headquartered in Portland, Oregon, announced today that their companies have joined. The expanded company will operate under the Innovyze name going forward. As the new expanded Innovyze, they will be able to offer the most complete wet infrastructure modeling and management solutions and support all technology platforms from workgroup management to AutoCAD-centric, ArcGIS-centric, GIS-based,

How to use a Small INI file with the Batch Program of #SWMM5

Image
A great feature of SWMM5 is the ability to use batch files to call the Console engine of SWMM5 or SWMM5.EXE.  This is used by many students and professionals for Monte Carlo and other analysis.  Here is a sample batch file and Figure 1 shows the screen output. swmm5.exe Example1.inp Example1.rpt Example1.out swmm5.exe Example2.inp Example2.rpt Example2.out swmm5.exe Example3.inp Example3.rpt Example3.out REM RPT is the text output file    REM OUT is the binary graphics output file pause Figure 1 - Windows DOS Batch File Screen an issue is that once you run the SWMM5.EXE program you cannot see the graphs in the GUI. However, you can make a small ini file as in this  here is an example of minimum ini file for example1.inp [SWMM5] Version=51011 [Results] Saved=1 Current=1 if you have this ini file then the graph icons are turned on (for example1.inp in Figure 2) but not for Example2.inp (Figure 3) as it did not have an ini file. Figure 2 - Using a small INI file turns on the Graphics in

How to Model and Display Peaking Factors in InfoSWMM

Image
How to Model and Display Peaking Factors in InfoSWMM  A significant difference between InfoSewer/H2OMap Sewer and InfoSWMM/H2OMap SWMM is how peaking factors are applied to the dry weather flow (DWF) at the nodes.  InfoSewer has unspeakable and peakable flow with the peakable flow equation defined in the peaking tab of the Run Manger (Figure 1).  The peakable flow equation is only used in the Steady State solution of InfoSewer. InfoSWMM only has unspeakable flow and no way to define peakable flow.  This blog shows a way to externally calculate the peakable flow in Excel and apply it as a DWF Scenario DB in InfoSWMM/H2OMap SWMM.  Here is a list of steps you can take to show the peakable load in InfoSWMM/H2OMap SWMM.  Figure 12 contrasts the peakable flow estimate in InfoSWMM compared to the InfoSewer peakable steady state flows. Step 1 .  Enter the DWF Unpeakable flow in the InfoSWMM DWF DB table without a DWF Pattern (Figure 2).  We will run the model with constant inflow to

Innovyze Introduces InfoMaster WMS: Comprehensive Work Order and Inspection Management Software to Help Water/Wastewater Utilities Optimize Field Service and Repair Operation

Innovyze Introduces InfoMaster WMS: Comprehensive Work Order and Inspection Management Software to Help Water/Wastewater Utilities Optimize Field Service and Repair Operation Revolutionary New Extension Lets Users Manage the Entire Lifecycle of Work Orders and Inspections Broomfield, Colorado, USA, April 25, 2017 – Innovyze, a leading global innovator of business analytics software and technologies for smart wet infrastructure, today announced the release of InfoMaster WMS (Work Management System) for managing the entire lifecycle of work orders and inspections. Available as an extension to its industry-leading InfoMaster asset management software, InfoMaster WMS lets water and wastewater utilities manage their work orders and inspections business processes with more automation and less paper. A complete ArcGIS-centric CMMS solution, it saves enterprises valuable time and money by better organizing, planning and proactively managing all maintenance activities. Maintaining

Area of a Manhole in #SWMM5

Image
The default area of a manhole is used if the inverts of the connecting links are all above the invert of the node: 1.      Invert of the node to the Invert of the lowest connecting link, the area of the manhole is 1.2 square meters or whatever the user defines, 2.      If the water surface is between the invert of the lowest connecting link and the soffit of the highest connecting link then the area of the node is ½ of the area of the connecting links 3.      If the water surface of the node is above the soffit of the highest connecting link then the area of the node is zero and the program tries to balance the flow into and out of the node so the total flow is zero