How to Model and Display Peaking Factors in InfoSWMM
How to Model and Display Peaking Factors in InfoSWMM
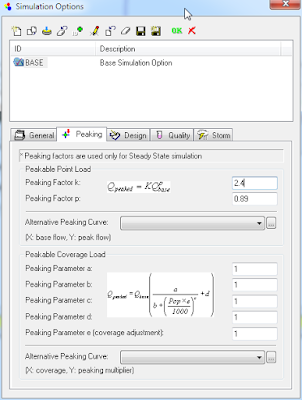
A significant difference between InfoSewer/H2OMap Sewer and InfoSWMM/H2OMap SWMM is how peaking factors are applied to the dry weather flow (DWF) at the nodes. InfoSewer has unspeakable and peakable flow with the peakable flow equation defined in the peaking tab of the Run Manger (Figure 1). The peakable flow equation is only used in the Steady State solution of InfoSewer. InfoSWMM only has unspeakable flow and no way to define peakable flow. This blog shows a way to externally calculate the peakable flow in Excel and apply it as a DWF Scenario DB in InfoSWMM/H2OMap SWMM. Here is a list of steps you can take to show the peakable load in InfoSWMM/H2OMap SWMM. Figure 12 contrasts the peakable flow estimate in InfoSWMM compared to the InfoSewer peakable steady state flows.
Step 1. Enter the DWF Unpeakable flow in the InfoSWMM DWF DB table without a DWF Pattern (Figure 2). We will run the model with constant inflow to simulate the Steady State solution in InfoSewer.
Step 2. The DWF can also be entered at the node level of the Attribute Browser. Figure 3 shows the DWF loads at the Nodes using lateral flow as the mapping parameter.
Step 3. Using Run Manager in InfoSWMM run the model using the constant DWF loads.
Step 4. Find the Total Flow at Each Node using the Customized Report Manager Tool from the model output. We will use the total flow to calculate the peakable flow at each node (Figure 4).
Step 5. Using the Customized Report Manager Tool find the total flow at each node (Figure 5) by defining the data source as a junction.
Step 6. Use only the Junction ID and Total Inflow in the Custom Table (Figure 6).
Step 7. Click Finish to Generate the Report (Figure 7).
Step 8. Copy the ID and Output Columns to the Clipboard (Figure 8).
Step 9. Copy the ID and Output Columns to Excel and calculate the Peakable Flow (Figure 9) using the peaking equation Flow = 2.4 * Unpeakable Flow ^ 0.84.
Step 10. Copy the ID and Peakable Flow to another Scenario's DWF DB Table. We call the two scenarios unspeakable and peakable (Figure 10).
Step 11. You now have a Peakable and Unpeakable DWF Table and Scenario which you can use to Map the peakable and unspeakable flows (Figure 11).
Step 12. Flows are now Peakable Flows if Mapped as Lateral Inflow (Figure 12).
Step 13. Figure 13 shows the peakable flows in InfoSewer. They match the Excel calculation tables and the peakable DB table in InfoSWMM. The peakable flow in InfoSewer is based on the routed unspeakable flows to the node.
Figure 1. Peaking Factor Equation in InfoSewer/H2OMap Sewer
Figure 2. Constant DWF in InfoSWMM as Unpeakable Flow in the Value Column of the DB Table.
Figure 3. The DWF can also be entered in the Attribute Browser of InfoSWMM. Here is map of the DWF lateral flow Nodes.
Figure 4. We will find the Total Flow at Each Node using the Customized Report Manager Tool.
Figure 5. Define the Data Source as a Junction.
Figure 6. Use only the Junction ID and Total Inflow in the Custom Table.
Figure 7. Click Finish to Generate the Report.
Figure 8. Copy the ID and Output Columns to the Clipboard.
JUNCTION: ID (Char) | OUTPUT: T_INFLOW (cfs) | Peaked Flow |
10309 | 30 | 49.52781382 |
15009 | 10 | 18.6299308 |
16009 | 30 | 49.52781382 |
16109 | 20 | 34.52454294 |
80408 | 10 | 18.6299308 |
80608 | 20 | 34.52454294 |
81009 | 10 | 18.6299308 |
81309 | 10 | 18.6299308 |
82309 | 20 | 34.52454294 |
Figure 9. Copy the ID and Output Columns to Excel and calculate the Peakable Flow.
Figure 10. Copy the ID and Peakable Flow to another Scenario’s DWF DB Table.
Figure 11. You can have a Peakable and Unpeakable DWF Table and Scenario.
Figure 12. Flows are now Peakable Flows if Mapped as Lateral Inflow.
Figure 13. Peakable flows in InfoSewer at the Links


Comments
Post a Comment