Posts

Showing posts from October, 2016

How to Use Scatter Plots in the DB Output tables of #InfoSWMM for d/D and q/Q

Image
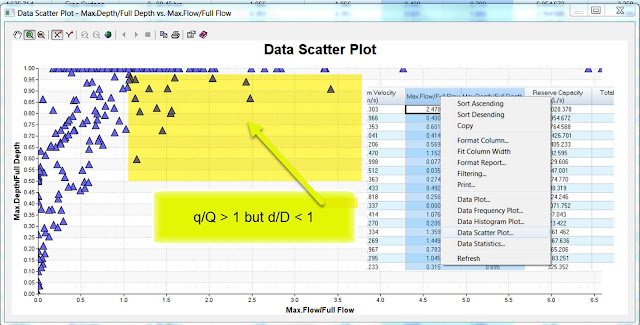
How to Use Scatter Plots in the DB Output tables of #InfoSWMM All of the SWMM5 output tables are available in the output report manager of InfoSWMM and H2OMap SWMM.  A key output table is the conduit summary table where the maximum link values are shown.  You can use the right mouse click to see the statistics, plot, frequency plot, histogram graph and scatter graph for the selected column.  If you select two columns you can make a scatter plot.  An interesting scatter graph is the d/D or capacity of the pipe versus q/Qfull for the pipe.  Qfull is based on the full pipe depth, area and hydraulic radius using the bed slope.  Due to the fact that InfoSWMM, SWMM5 and H2OMap SWMM use the full St. Venant solution you can have a q/Qfull greater than 1 when the d/D is less than 1.  Here are some St. Venant solution in SWMM5 blogs for reference. http://www.swmm5.net/search/label/St.%20Venant http://www.swmm5.net/2016/10/more-st-venant-equations-in-swmm5.html http://www.swmm5.net/2016/10/s

Update for [USEPA/SWMM-EPANET_User_Interface] MTP 3

Image
Just a note about the great work being done on the new EPANET and SWMM 5 QGIS interface. This is the third Minimum Testable Product, released for testing of specific functionality. This is not a fully functional product and is not suitable for production use. — You are receiving this because you are subscribed to this thread. View it on GitHub  

InfoSWMM, InfoSewer and InfoWater from Innovyze connection between your model data and your GIS data

Image
One of the great features about InfoSWMM, InfoSewer and InfoWater from Innovyze is the intimate connection between your model data and your GIS data. It is important for this to work correctly that you use the correct spatial reference. Innovyze has many tools for changing the spatial reference: 1. Arc GIS TOC 2. Arc Toolbox projection tools 3. Innovyze tools for changing the spatial reference 4. Innovyze tools for margining spatial reference 5. GIS background maps from ESRI 6. Google Earth and Google Maps connections

A great twitter header image from our @Innovyze Channel Partners in Spain @sp_infoworks

Image
A great twitter header image from our @Innovyze Channel Partners in Spain @sp_infoworks #rt pic.twitter.com/NjVKfhr0Ir — Robert Dickinson (@InnovyzeRobert) October 21, 2016

RDII Analyst, SWMM5 and ICM SE - Diagram of R, T and K parameters for RDII

Image
RDII Analyst, SWMM5 and ICM SE - Diagram of R, T and K parameters for RDII.  RDII Analyst in H2OMap SWMM and #InfoSWMM can export using the SWMM5 Export Exchange tool SWMM5 files with calibrated RTK parameters for #SWMM5 and #InfoWorks_ICM

How to Use Arc Map Selection to add to Domains in #InfoSewer and #InfoSWMM

Image
How to Use Arc Map Selection to add to Domains in #InfoSewer and #InfoSWMM: Use the Arc Map Selection Tools Select a layer of Nodes or Links in Arc Map Add your elements to the Arc Map Selection and finally Add the selected elements from Arc Map to the InfoSewer Domain (Bullet 4) How to Use Arc Map Selection to add to Domains in #InfoSewer and #InfoSWMM

More St Venant Equations in #SWMM5

Image
This blog shows the relationship between the terms dq1, dq2, dq3 and dq4 in the SWMM5 code and the St. Venant Partial Differential Equations. dq2 = Time Step * Area wtd * (Head Downstream – Head Upstream) / Link Length or dq2 = Time Step * Area wtd * (HGL) / Link Length Qnew = (Qold – dq2 + dq3 + dq4) / ( 1 + dq1) when the force main is full dq3 and dq4 are zero and Qnew = (Qold – dq2) / ( 1 + dq1) The dq4 term in dynamic.c uses the area upstream (a1) and area downstream (a2), the midpoint velocity, the sigma factor (a function of the link Froude number), the link length and the time step or dq4 = Time Step * Velocity * Velocity * (a2 – a1) / Link Length * Sigma the dq3 term in dynamic.c uses the current midpoint area (a function of the midpoint depth), the sigma factor and the midpoint velocity dq3 = 2 * Velocity * ( Amid(current iteration) – Amid (last time step) * Sigma dq1 = Time Step * RoughFactor / Rwtd^1.333 * |Velocity| The weighted area (Awtd) is used in the dq2 term of the St

Hydraulic Jump and Froude # in #SWMM5

Image
In this blog we example the Froude Number values computed in SWMM5 as equations, table, graphs and units. We use a QA/QC version of SWMM 5 that lists many more link, node, system and Subcatchment variables than the default SWMM 5 GUI and engine. This blog also applies to #InfoSWMM and any software the uses the #SWMM5 engine.  SWMM 5 computes only one flow in the middle of the link but it uses depth, head, cross sectional area and hydraulic radius at the upstream, midpoint and downstream points of the link (Figure 1).  The Froude # is computed at all three points and if you could see the Froude # you will see a jump at times in a single link (Figure 2). Figure 1.  Computational points in #SWMM5 Figure 2.  Three locations of the Froude Number - it is possible to see where the Hydraulic Jump occurs in the link.

Horton Animation of Infiltration in #SWMMM5 and #INFOSWMM

Image
Overview In this blog we look at GIF of how Horton Infiltration works in #SWMM5 and #InfoSWMM and any other GUI that uses the SWMM5 Engine.

#SWMM5 1-D St Venant Equation Terms

Image
Overview In this blog we show how the St Venant terms are used in SWMM5 as equations, table, graphs and units. We use a QA/QC version of SWMM 5 that lists many more link, node, system and Subcatchment variables than the default SWMM 5 GUI and engine. This also applies to #InfoSWMM and any software the uses the #SWMM5 engine. SWMM5 is using is the most advanced equations as it takes into consideration the full dynamic (St. Venant) equations and not the more simplified kinematic wave / manning equations. The manning equation only considers the uniform flow conditions which represents a situation where the gravitational force on a column of water (due to the channel slope) balances out the frictional force. The full dynamic equations contains additional factors that affect the movement of water in a conduit or channel. These include the pressure force due to variation of depth along the length of the channel and the inertial (or convective acceleration) effect due to variation of flow ar

Various Videos of Flow into a Stormwater Inlet in Florida

Image
Various Videos of Flow into a Stormwater Inlet in Florida You can see gutter on the street,  chaotic flow into the inlet and very large scale pollution in the open area of the manhole,

Innovyze President Dr. Paul F. Boulos Reelected to the American Academy of Water Resources Engineers Board of Trustees

Innovyze President Dr. Paul F. Boulos Reelected to the American Academy of Water Resources Engineers Board of Trustees Broomfield, Colorado, USA, October 14, 2016 Innovyze, a leading global innovator of business analytics software and technologies for smart wet infrastructure, today announced that its president, chief operating officer and chief innovation officer, Paul F. Boulos, Ph.D., BCEEM, Hon.D.WRE, Dist.D.NE, Dist.M.ASCE, NAE, has been reelected for a three-year term to the Board of Trustees of the American Academy of Water Resources Engineers (AAWRE) of the American Society of Civil Engineers (ASCE). His term began October 1, 2016. He previously served as 2014 AAWRE President and on the AAWRE Board of Trustees from 2009 to 2015. Dr. Boulos is one of the world’s foremost experts on water resources and navigation engineering and the author of ten authoritative books and more than 200 technical articles on issues critical to the water and wastewater industry. He is the recipient o

An infographic on Nodes in #SWMM5, #InfoSWMM and #H2OMap SWMM

Image
An infographic on Nodes in #SWMM5, #InfoSWMM and #H2OMap SWMM

#SWMM5 has Topological sorting of conveyance network links

Image
SWMM5 has Topological sorting of conveyance network links in toposort.c  It sorts the network for kinematic wave but also finds the degree of number of links out of a node.  An upstream node has a negative degree and an outfall has a degree of zero.  The degree of the node is used to determine the node composition for the OUTFLOWS file in SWMM 5.  Figure 1 shows the node degrees for a sample network.  Figure 1. The -  node degrees for a sample network.

How to Use the Input HGL with a Domain in #INFOSEWER

Image
How to Use the Input HGL with a Domain in #INFOSEWER 1. 1st make a domain out of a selection set using the domain manager, 2. Click on the Input HGL profile 3. Add the domain to the selection using the right mouse click 4. Use the right mouse click again and click enter 5. You should see the Input HGL for the domain How to Use the Input HGL with a Domain in #INFOSEWER

How Domains are Seen in #INFOSWMM and #INFOSEWER

Image

Latest #InfoSWMM is update 3 - dated 9/2/2016

Image

Arc GIS Tools for 2D Polygon Processing

Image
Arc GIS Tools for 2D Polygon Processing Clip – restrict data to area of extents Buffer – offset polygon data Dissolve – merge polygons Multipart to Singlepart – make features individual (need to run after using dissolve) Repair geometry – fix bad geometry Erase – remove features inside areas Integrate – align polygons

A map of how Keep, Ignore and Dampen are used in #INFOSWMM and #SWMM5

Image
A map of how Keep, Ignore and Dampen are used in #INFOSWMM and #SWMM5.   The Keep, Ignore and Dampen opens are important it the engine for controlling which St. Venant terms are used.

The effect of backwater and depth downstream on the links and depths upstream in #SWMM5

Image
Do not forget that the downstream links of your model can affect the d/D and other hydraulic terms in the current link.   The downstream link with backwater raises the downstream link depth which affects the depth and d/D in the link of interest.  For example,   The d/D is higher in link CDT-2253 due the effect of a fuller pipe downstream (1).  The d/D is the value in the middle of the link and it averages the downstream and upstream d/D.    The flow in CDT-2249 is 160 and the d/D is 0.47 but even though the flow in CDT-2253 is the same, the d/D is higher as the pipe downstream Pipe-4520 is fuller due to a flow of 425.  The higher d/D in Pipe-4520 means that the downstream d/D of CDT-2253 is higher as The d/D is the middle value and is the average of the depths at the upstream and downstream points of the link. CDT-2249 has a d/D of 0.47 as it does not have a downstream effect. HGL Graph in #InfoSWMM