How to Use Scatter Plots in the DB Output tables of #InfoSWMM for d/D and q/Q
How to Use Scatter Plots in the DB Output tables of #InfoSWMM
All of the SWMM5 output tables are available in the output report manager of InfoSWMM and H2OMap SWMM. A key output table is the conduit summary table where the maximum link values are shown. You can use the right mouse click to see the statistics, plot, frequency plot, histogram graph and scatter graph for the selected column. If you select two columns you can make a scatter plot.
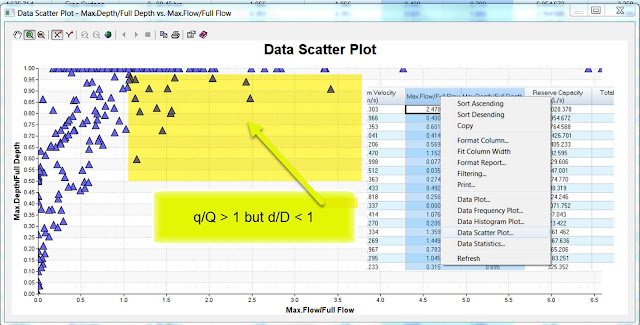
An interesting scatter graph is the d/D or capacity of the pipe versus q/Qfull for the pipe. Qfull is based on the full pipe depth, area and hydraulic radius using the bed slope. Due to the fact that InfoSWMM, SWMM5 and H2OMap SWMM use the full St. Venant solution you can have a q/Qfull greater than 1 when the d/D is less than 1. Here are some St. Venant solution in SWMM5 blogs for reference.
 |
| Figure 1 - How to Use Scatter Plots in the DB Output tables of #InfoSWMM for d/D and q/Q |


Comments
Post a Comment