Posts

How to show Curve RTC Rules in #SWMM5 in the Control Actions Taken Section

#SWMM5 has very flexible control rules.  The rules are shown in the controls.c code.  However, one aspect I did not know was that if a rule is based on a control curve the RPT logging of the control actions is not shown.  You  can change by changing and compiling the code.  You will need to get rid of the half rule   && a1->curve < 0                       so that the changing of the target setting is logged – see below for a snippet of the code. Here is a sample curve tool RULE MC3 IF SIMULATION TIME > 4 AND SIMULATION TIME <= 6 THEN PUMP Gbp1 SETTING = CURVE myControl Priority 3 And here is the control action log in the RPT file – it helps to see this log and verify the rules   *********************   Control Actions Taken   *********************    01/01/2013: 00:00:00 Link Gbp1 setting changed to ...

Beautiful-equations-how-insects-walk-on-water-and-galaxies-form Navier-Stokes

SWMM and SWMM 5 History from Past Wikipedia SWMM5 pages

Image
SWMM and SWMM 5 History from Past Wikipedia SWMM5 pages – added by me as someone keeps editing the Wikipedia page and getting rid of this table.  Figure 1 is the past Wikipedia page and Figure 2 is the connection between SWMM5 and Innovyze’s InfoSWMM.  Current information can be found here https://www.wikiwand.com/en/Storm_Water_Management_Model Figure 1 - Past Wikipedia Table for SWMM and SWMM5. Figure 2 - SWMM5 and InfoSWMM Versions

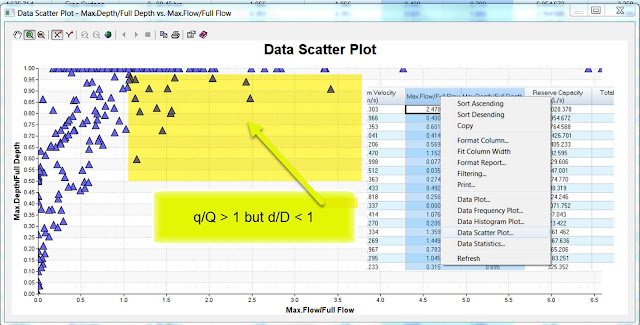
How to Use Scatter Plots in the DB Output tables of #InfoSWMM for d/D and q/Q

Image
How to Use Scatter Plots in the DB Output tables of #InfoSWMM All of the SWMM5 output tables are available in the output report manager of InfoSWMM and H2OMap SWMM.  A key output table is the conduit summary table where the maximum link values are shown.  You can use the right mouse click to see the statistics, plot, frequency plot, histogram graph and scatter graph for the selected column.  If you select two columns you can make a scatter plot.  An interesting scatter graph is the d/D or capacity of the pipe versus q/Qfull for the pipe.  Qfull is based on the full pipe depth, area and hydraulic radius using the bed slope.  Due to the fact that InfoSWMM, SWMM5 and H2OMap SWMM use the full St. Venant solution you can have a q/Qfull greater than 1 when the d/D is less than 1.  Here are some St. Venant solution in SWMM5 blogs for reference. http://www.swmm5.net/search/label/St.%20Venant http://www.swmm5.net/2016/10/more-st-venant-equations-in-swmm5.h...

Update for [USEPA/SWMM-EPANET_User_Interface] MTP 3

Image
Just a note about the great work being done on the new EPANET and SWMM 5 QGIS interface. This is the third Minimum Testable Product, released for testing of specific functionality. This is not a fully functional product and is not suitable for production use. — You are receiving this because you are subscribed to this thread. View it on GitHub  

InfoSWMM, InfoSewer and InfoWater from Innovyze connection between your model data and your GIS data

Image
One of the great features about InfoSWMM, InfoSewer and InfoWater from Innovyze is the intimate connection between your model data and your GIS data. It is important for this to work correctly that you use the correct spatial reference. Innovyze has many tools for changing the spatial reference: 1. Arc GIS TOC 2. Arc Toolbox projection tools 3. Innovyze tools for changing the spatial reference 4. Innovyze tools for margining spatial reference 5. GIS background maps from ESRI 6. Google Earth and Google Maps connections

A great twitter header image from our @Innovyze Channel Partners in Spain @sp_infoworks

Image
A great twitter header image from our @Innovyze Channel Partners in Spain @sp_infoworks #rt pic.twitter.com/NjVKfhr0Ir — Robert Dickinson (@InnovyzeRobert) October 21, 2016