Posts

Showing posts from April, 2017

Innovyze Introduces InfoMaster WMS: Comprehensive Work Order and Inspection Management Software to Help Water/Wastewater Utilities Optimize Field Service and Repair Operation

Innovyze Introduces InfoMaster WMS: Comprehensive Work Order and Inspection Management Software to Help Water/Wastewater Utilities Optimize Field Service and Repair Operation Revolutionary New Extension Lets Users Manage the Entire Lifecycle of Work Orders and Inspections Broomfield, Colorado, USA, April 25, 2017 – Innovyze, a leading global innovator of business analytics software and technologies for smart wet infrastructure, today announced the release of InfoMaster WMS (Work Management System) for managing the entire lifecycle of work orders and inspections. Available as an extension to its industry-leading InfoMaster asset management software, InfoMaster WMS lets water and wastewater utilities manage their work orders and inspections business processes with more automation and less paper. A complete ArcGIS-centric CMMS solution, it saves enterprises valuable time and money by better organizing, planning and proactively managing all maintenance activities. Maintaining

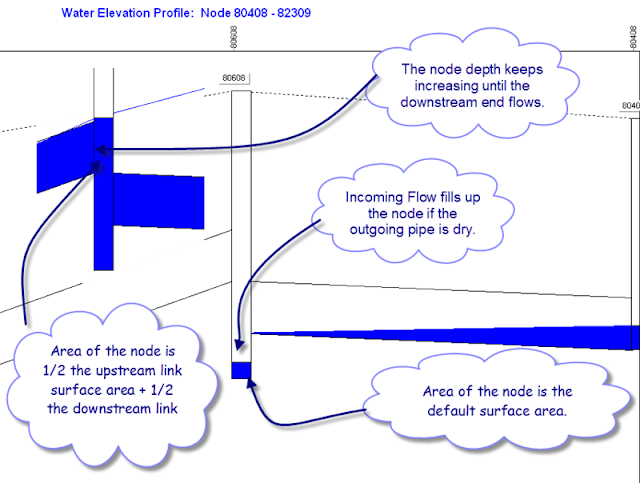
Area of a Manhole in #SWMM5

Image
The default area of a manhole is used if the inverts of the connecting links are all above the invert of the node: 1.      Invert of the node to the Invert of the lowest connecting link, the area of the manhole is 1.2 square meters or whatever the user defines, 2.      If the water surface is between the invert of the lowest connecting link and the soffit of the highest connecting link then the area of the node is ½ of the area of the connecting links 3.      If the water surface of the node is above the soffit of the highest connecting link then the area of the node is zero and the program tries to balance the flow into and out of the node so the total flow is zero

Simple SI Unit Model for SWMM5 LID with 100 mm Rainfall - Part 2

Image
This blog is a companion to the blog post https://swmm5.org/2017/04/17/swmm5-simple-100-mm-rainfall-model-for-lid-modeling-part-1/ in which a 1 Hectare model with 100 mm of rainfall had a simple Bio-Retention Cell with no LID outflows.  In part 2 of this blog series we will add a drain coefficient of 10 mm/hr (Figure 1).  The internal pervious area is 0.375 hectares, the nonLID area is 0.75 hectares and the two impervious area are 0.1875 hectares each. The example uses 100 mm of rainfall or precipitation to make the comparisons easier.  The LID Drainage outflow of 27.93 mm (Figure 2) is 6.98 mm over the whole 1 hectare Subcatchment (Figure 3). The BMP removal is still 100 percent of the SF1 pollutant generation Figure 1 A 10 mm/hr Drain Coefficient to the LID Figure 2   The LID now has Drain outflow of 27.84 mm Figure 3 The LID Drainage outflow of 27.93 mm (Figure 2) is 6.98 mm over the whole 1 hectare Subcatchment

#SWMM5 Simple 100 mm Rainfall model for #LID modeling - Part 1

Image
Simple SI Unit Model for SWMM5 LID with 100 mm Rainfall . Reading this blog and using the embedded SWMM 5 example file, you will run a simple SI unit model based on factors of 1 and 10. The LID (Bio-Retention Cell) is designed to have zero outflows, Figure 1, as the storage is set to 1000 mm. The Subcatchment area is 1 hectare, the prevent impervious is ½ hectare divided into ¼ hectare sections with and without depression storage, the pervious area is ½ hectare (Figure 2). The LID Bio-Retention area is ¼ hectare or 25 percent of the Subcatchment. The SWMM5 divides the Subcatchment into nonLID and Lid sections (Figure 3) and the impervious area and pervious areas are automatically reduced by the SWMM5 engine (Figure 6). The internal pervious area is 0.375 hectares, the nonLID area is 0.75 hectares and the two impervious area are 0.1875 hectares each. The example uses 100 mm of rainfall or precipitation to make the comparisons easier. Figure 1  SWMM 5 Bio-Retention Cell Example with sett

InfoSWMM SA SWMMLive Manager

Image
InfoSWMM SA SWMMLive Manager is the single utility in InfoSWMM SA to manage all interactions between InfoSWMM SA models and SWMMLive model data exchange. It exports the active InfoSWMM SA scenario as the baseline model to SWMMLive. It allows extension of selected InfoSWMM SA scenarios as additional supporting model data to SWMMLive for scenario switching. It also accepts an exported SWMMLive model for detailed diagnosis run in InfoSWMM SA, supported with all the familiar InfoSWMM SA utilities. InfoSWMM SA  SWMMLive  Manager is accessed from the  AddOn Extension Manager  via its toolbar button or from the Tools menu (Tools - AddOn Extension Manager). The InfoSWMM SA SWMMLive Manager User Interface is shown below. The InfoSWMM SA SWMMLive Manager main dialog box has three tabs: Export Model to SWMMLive, Extend Scenario Data to SWMMLive, and Diagnose SWMMLive Model.  All model exchanges between InfoSWMM SA and SWMMLive are made through model definition files with extension inp. Export Mod

How can there be more flow in a pipe than its full capacity? #SWMM5 and #InfoSWMM

This post is borrowed from our Innovyze blog and modified for #SWMM5 http://blog.innovyze.com/2017/03/31/surcharge-flow-vs-pipe-full-capacity-in-icm/ You may have noticed, that in some instances, the Pipe full capacity value on a pipe in #SWMM5 is less than the maximum simulation flow in a surcharged pipe. How can there be more flow in a pipe than its full capacity? The Qfull in the link input summary table is calculated from the Manning's equation. Manning's equation is simpler than the full solution St Venant equations used by the SWMM5 simulation engine used to generate the model results. Therefore, there can sometimes be differences between Qfull (based on the slope) and the actual flow that can discharge as calculated using the 1D St Venant Equations. The Qfull value is only intended to be an approximation/reference for the user. It is not used by the engine to determine when a pipe goes into surcharge. Manning's equation assumes that the pipe is infinitely long and th

Use Sublime Text to Diff two files in the same folder for SWMM 5 C Code

Image
Sublime Text is nice but not a free Text Editor for large files.  However, it does have a limited file difference capability – here is how you can use Sublime Text to Diff two files in the same folder for SWMM 5 C Code.  You can also use this to compare dozens of files in Sublime - which is needed for a program such as SWM 5 which has been continuously updated from 2003 to 2017 with at least 35? major version.  This makes it easy for example to compare the groundwater or rdii code between 2005 / 2012 and 2017, for example.

EPA #SWMM5 Build 5.1.012 (03/14/17) Updates

SWMM 5.1 Update History ======================= https://www.epa.gov/water-research/storm-water-management-model-swmm#downloads ------------------------ Build 5.1.012 (03/14/17) ------------------------ Engine Updates: 1. The direct.h header is now only #included in the swmm5.c file when compiled for Windows. (swmm5.c) 2. Engine Update #7 in Build 5.1.011 (internally aligning the wet time step with the reporting time step) was redacted since it caused problems for certain combinations of time steps. (runoff.c) 3. A subcatchment's bottom elevation is now used instead its parent aquifer's value when saving a water table value to the binary results file. (subcatch.c) 4. A bug that failed to limit surface inflitration into a saturated rain garden LID unit was fixed. (lidproc.c) 5. Calculation of the maximum limit on LID drain flows was modified to produce smoother results at low depths above the drain offset. (lidproc.c) 6. A variable used for r

Graphing Infographic for #InfoSWMM

Image
Graphing Infographic for InfoSWMM. Three different ways to run models : 1. Batch Mode 2. Single Run Manager 3. Changing Scenarios and then using the Single Run Manager 4. Your number one debugging tool is the System graphs, it tells you the total rainfall, runoff, flooding, outflow and storage in one easy to see graph or table