Posts

Showing posts from December, 2011

How to use SWMM 5 DOS to make an Output Table in the RPT file

Image
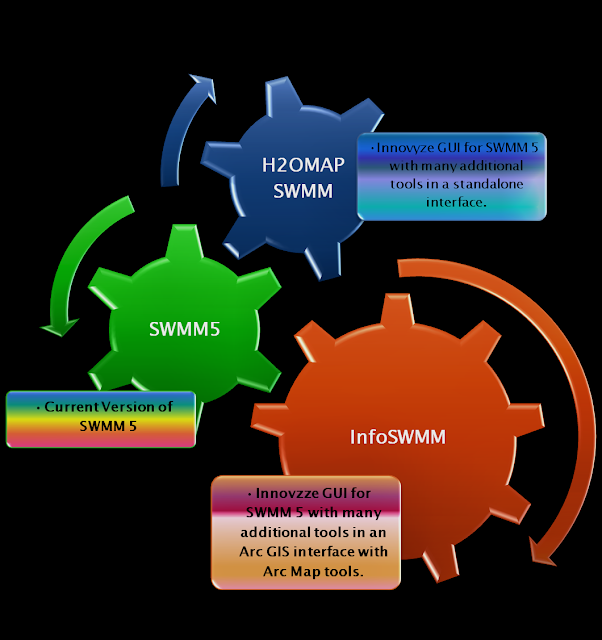
Subject:    How to use SWMM 5 DOS to make an Output Table in the RPT file You can make tables of the node,  link  and  Subcatchment output data in SWMM 5 if you use the DOS SWMM 5 program but not the Windows DLL.   Step 1 is to create the DOS batch file, Step 2 is to select the nodes, links and subcatchments, Step 3 is to run the batch file and Step 4 is to view the RPT tables or extract the data to Excel.  You can do this directly in the InfoSWMM and H2OMAP SWMM graphical user interfaces by using Run Manager, Step 5 to select the nodes, links and subcatchments and Step 6 to view the tables in the browser. Step 1.    Make a Batch File to call the DOS SWMM 5 swmm5.exe Example1.inp  D:\swmm5.0.022\bob.rpt pause Step 2.   Add the nodes,  links and  subcatchments tables you want to generate in the RPT file [REPORT] CONTROLS         NO LINKS                 ALL NODES               ALL SUBCATCHMENTS ALL Step 3.   Run the Batch file Step 4.   Extract the Tables from the RPT File of SWMM

RDII or Tri Triangular Unit Hydrograph in InfoSewer

Image
Subject:   RDII or Tri Triangular Unit Hydrograph in InfoSewer RDII or Tri Triangular Unit Hydrograph in InfoSewer by  dickinsonre Subject:   RDII or Tri Triangul ar Unit Hydrograph in InfoSewe r The RDII method in InfoSewer is similar to the RDII or RTK  method in  InfoSWMM with some differences.    The RTK data for triangles 1, 2 and 3 are defined in the Unit Hydrograph but instead of individual R values, the overall R is set and the Percent R1,  R2 and R3 are defined based on the total  R.  R3 is calculated internally as 100 – R1 – R2.   Each loading manhole with RDII flow has a total  area, a hyetograph and a Unit Hydrograph.  The hyetograph has to be set at multiples of the unithydrograph, so you can define the time or X columns with integers and then use the Block Edit command to change X to minutes by multiplying  by the Unit Hydrograph time (Figure 1).   You can use only one component if you set R1 or R2 to 100 percent or R3 to 100 percent by setting R1 and R2 to 0 percent (Fig

How is the Maximum Link Flow Applied in SWMM 5?

Image
Subject:   How is the Maximum Link Flow Applied in SWMM 5? How is the Maximum Link Flow Applied in SWMM 5? by  dickinsonre Subject:   How is the Maximum Link Flow Applied  in SWMM 5? The maximum flow limit for a link applies to the kinematic wave and the dynamic wave solution.   The inflow to the link  in the kinematic wave solution is limited (Figure 1) but the calculated link flow is limited in the dynamic wave solution after the link flow (Figure 2): 1.        Is checked using the Culvert Inlet Equations (optional) 2.       The normal flow equation is checked (internally optional depending on the Normal flow options) and 3.       The Picard iteration solution under relaxation parameter (always 0.5) is applied (Figure 3). Figure 1.   Kinematic Wave Solution Limits the Inflow to  the Link Maximum limit. Figure 2 . Dynamic Wave Solution link  flow limit. Figure 3.   The Link  flow in the dynamic wave solution has three checks at each iteration in a time step. via Blogger  http://www.sw

Adverse Slope Convention in SWMM 5

Image
Subject:   Adverse Slope Convention  in  SWMM 5 If the slope of a link  is negative and the solution  is dynamic wave then the following data will be switched in link.c in SWMM 5.  All upstream data for the  link  is switched to the downstream end of the link  and  vice versa.   The means that if the flow  is from the original upstream node to the downstream node the flow  will  be negative in the output of  SWMM 5.  Negative flow in SWMM 5 means: 1.    The link has an adverse or negative slope, 2.    The link  has reverse flow if the link slope is positive. Adverse Slope Convention  in  SWMM 5

Esther Dyson on Business Insider

Weather InfoGraphics

Image
Weather Infographics by  dickinsonre   Source:    http://visual.ly/ cloud-types-and- pronunciations-cloud-spotting http://visual.ly/how-forecast- weather -without-gadgets via Blogger  http://www.swmm5.net/2013/08/ weather-infographics.html

How to make a shape file from a Output Relate in InfoSWMM

Image
Note:    How to make a shape file from a Output Relate in InfoSWMM: How to make a shape file from a Output Relate in InfoSWMM by  dickinsonre Note:    How to make a shape file from a Output Relate in InfoSWMM Step 1.   Make an Output Relate for the Conduit Summary Table using the Operation Tab in Attribute Browser. Step 2:  Using the GIS Gateway you can save q/Q and d/D to a shape file that can then be added to the Arc GIS Table of  Contents Step 3.   You now have a Shape File for the value of q/Q or Flow over Full Flow.  You can also use the Symbology Tab in Data Properties to color and/or make bar charts and bubble charts from the summary q/Q and d/D values during the simulation for each link. via Blogger  http://www.swmm5.net/2013/08/ how-to-make-shape-file-from- output.html

InfoSWMM and H2OMAP SWMM Facility Manager

Image
InfoSWMM and H2OMap SWMM Facility Manager by  dickinsonre The InfoSWMM Facility Manager  offers the knowledgeable engineer complete control what elements are simulated in her or his model.  You can make active or inactivate elements based the type of Network Element, A Network Path, A Mouse Drawn Map Selection, The Domain, A selection set, a DB Query, a Query Set and a Special Query.  You can make the simulated network smaller or larger depending on your simulation or calibration requirements.  For example, you can have a whole basin network but model only a branch or a subset of the network if you are using the Calibrator or Designer Addons.   via Blogger  http://www.swmm5.net/2013/08/ infoswmm-and-h2omap-swmm- facility.html

How to Find the Proportional loading to a link or manhole in InfoSewer

Image
Subject:   How to Find the Proportional loading to a link  or manhole in InfoSewer How to Make Contours in InfoSWMM and H2oMAP SWMM by  dickinsonre Subject:    How  to Make Contours in InfoSWMM and H2OMAP SWMM It is easy to make contours out of node input data or node output data in InfoSWMM and H2oMAP SWMM  using the Contour Tool in the Contour Tab of the Attribute Browser.  You can control the resolution and the type of smoothing for the created contour (Figure 1).  If you haveInfoSWMM Suite you can use the Contour to DEM command in the Subcatchment Manager to convert the created Contour to an Elevation or DEM file (Figure 2 and Figure 3).   The Layer properties for the created elevation can be altered in Arc GIS to make a better visual depiction of the elevation (Figure 4). Figure 1.   Contour Tool in the Contour Tab of the Attribute Browser. Figure 2.   Contour to DEM command in the InfoSWMM Subcatchment Manager will convert the created Contour to an Elevation or DEM file. Figure 3

SWMM 5 Error Messages

Engine Error Number Description ERROR 101: memory allocation error.                                                                                             ERROR 103: cannot solve KW equations for Link                                                                                   ERROR 105: cannot open ODE solver.                                                                                              ERROR 107: cannot compute a valid time step.                                                                                     ERROR 108: ambiguous outlet ID name for Subcatchment                                                                            ERROR 109: invalid parameter values for Aquifer                                                                                  ERROR 110: ground elevation is below water table for Subcatchment